The list of new features are provided in the following link:
https://www.ibm.com/docs/en/planning-analytics/2.0.0?topic=workspace-2098-whats-new-august-21-2024
The defects list is in the link below:
https://www.ibm.com/support/pages/node/6192099
Key call outs in this release
Below are the key exciting features that are part of this release.
- Use the new Drive explorer to access the S: drive (Cloud only)
- Use the new Satellite Connector to connect to a private network (Cloud only)
- New filters added to cube viewer
- MDX editor updates
- Lock and unlock an element
WHAT’S NEW IN BOOKS AND REPORTING
The following new and changed features in books and reporting are available in Planning Analytics Workspace 2.0.98.
Dynamic to static set conversion when re-ordering members
When you move members in the Planning Analytics Workspace set editor, the set will be converted from a dynamic set to a static set.
When you convert to a static set, the MDX expression that generated the dynamic set is deleted and the set contains only the members that are present at the time of conversion.
When you re-order members in the Current set, or move a member from Available members into a dynamic set in the Current set, the following dialog box appears:
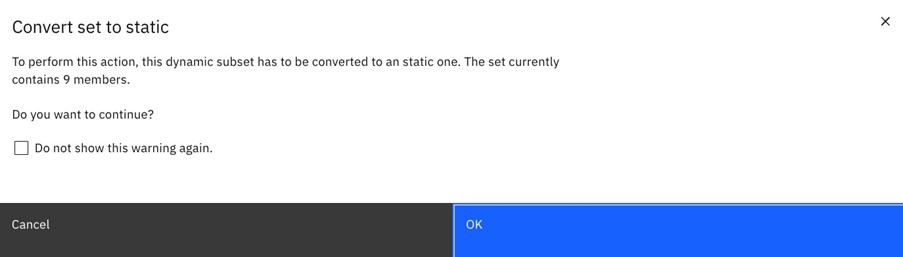
If you click OK, the members are converted to a static set and moved to the new location.
If you click the check box beside “Do not show this warning again”, the dialog box won’t appear when you move members. This input is only valid for the current user session.
To disable and enable this dialog box across all user sessions, navigate to Settings > General > Show dialog notification, and toggle the Show dialog notification option.
New burst export feature
You can now slice a book in Planning Analytics Workspace and burst export it to PDF or PowerPoint by using a single synchronization group. With this Burst export feature, you can automatically print each member of the set for a selected hierarchy to a PDF or PowerPoint file.
To use the Burst export feature:
- In Edit mode, select the view and enable hierarchy synchronization (Properties > Synchronization > Synchronize hierarchies).
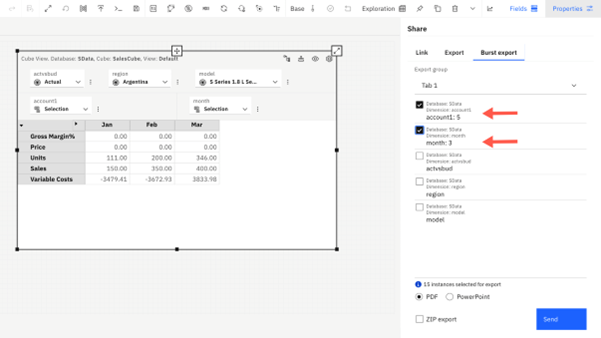
- Click Share in the toolbar and go to the Burst export
- Select the group that you want to export under Export group.
- Select the hierarchies that you want to export.
Note: When you select a hierarchy, the number of members in that hierarchy displays under the hierarchy name. If you select more than one hierarchy, the total number of instances that export are calculated based on all the data combinations for the selected hierarchies. You cannot export more than 100 instances. - Select the file type that you want to export to. If you want to export individual files for each instance, select ZIP export.
Improved application of member numeric formats
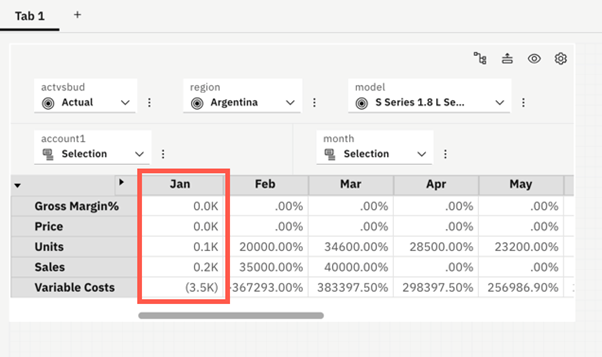
Member numeric formats are now retained when a numeric format is applied to the Data area in a view using the Format manager. Previously, applying numeric formats to the Data area of a view overrode the numeric formats of members.
In this view, notice Jan has a different numeric format from the other members in the view.
To change the numeric format for a member, right-click the member in a view and select Member format. Under Format data cells, select a numeric format.
To apply a global numeric format to the data cells in a view, select the view and click Format manager. Click Data area and select a numeric format.
More actions are now available in the Planning Analytics AI assistant (
The Planning Analytics AI assistant in Planning Analytics workspace now supports three new actions and can perform several additional member calculations.
(Note: Planning Analytics AI requires a separate licence)
The three new actions are List, Undo, and Redo. The additional member calculations are indicated in bold in the following table.
| Action | Definition of action | Command examples | Needs object/widget selected? |
| List | Shows all the specified objects on a database. You can list cubes, dimensions, sets, and views. | List cubes
List dimensions |
No |
| Undo | Undo a book action. | Undo | No |
| Redo | Redo a book action. | Redo | No |
| Perform member calculation | Perform calculations on specified members.
The supported calculations are: · Absolute value · Aggregate · Average · Division · Maximum · Median · Minimum · Multiplication · Percent change · Percent of · Percent parent · Percent total · Rank · Subtraction · Summation |
Calculate average for members “Jan”, “Feb”
Create maximum for members “Q1”, “Q2” Calculate minimum for members “Q1”, “Q2” |
Yes |
For more information, see Use the Planning Analytics AI assistant to interact with books using natural language.
New filters added to cube viewer
You can now filter rows and columns based on cell values in a cube in Planning Analytics Workspace.
Two new filters have been added to Planning Analytics Workspace: Filter by count and Filter by value.
To use these new filters, right-click on a row or column header, and select Filter. Then select Filter by count or Filter by value.
Note: You can only have one Filter by value or Filter by count filter active at the same time. If you apply another filter of the same type to the same view, the first filter will be removed.
Filter by count to filter members in a row or column to show the top or bottom members of a specified count type.
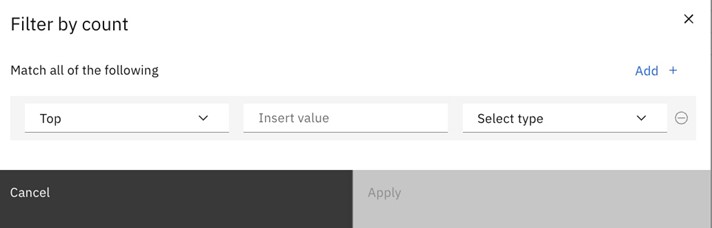
You can choose the following criteria when creating the filter:
- You can select if you want the filter to show the top or bottom members of your specified count type.
- You can choose the number of members you want to see included in the filter results. This value must be numerical.
- You can select the type of count you want to filter for. You can choose Items, Percent, or Sum.
- You can add an additional set of criteria for the filter. You can add a total of two sets of criteria in each filter.
Filter by value to filter the members in a row or column based on a selected value.
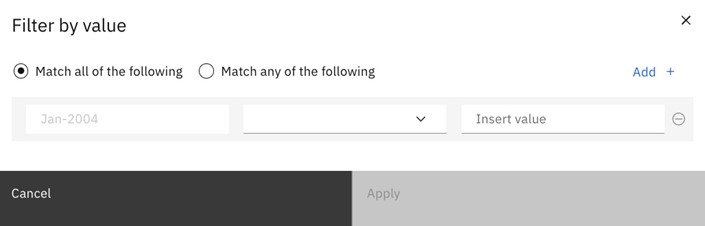
You can choose the following criteria when creating the filter:
- You can select a comparison operator for the filter. You can choose =(equal to), > (greater than), >= (greater than or equal to), < (less than), or <= (less than or equal to).
- You can choose the number you want the comparison operator to filter by. This value must be numerical.
- Select how you want the filter to match your criteria. Select Match all of the followingif you want the filter to only include members that match all of the criteria you set. Select Match any of the following if you want the filter to include members that match any of the criteria you set.
- You can add an additional set of criteria for the filter. You can add a total of three sets of criteria in each filter.
A row or column with a filter applied displays the filter icon .
WHAT’S NEW IN MODELING
The following new and changed modeling features are available in Planning Analytics Workspace 2.0.98.
Lock and unlock an element
You can now lock and unlock an element in Planning Analytics Workspace. This feature requires IBM Planning Analytics 2.0.9.19 (TM1 Server 11.8.023).
When a user locks an element, only those users who have Admin rights for that element can update the data that it identifies. Even the user who locks the element cannot update its data, unless they have Admin rights for that element.
Locking an element is a way to permanently archive the data that it identifies. Locks stay in place after the remote server shuts down.
MDX editor updates
A new MDX editor is now available in the [() IBM]® Planning Analytics Workspace books and modelling workbench.
Note: The new MDX editor is not currently available in Planning Analytics for Microsoft™ Excel.
The MDX editor allows you to make changes to the MXD expressions in a view.
To access the MDX editor, click the Edit MDX icon.
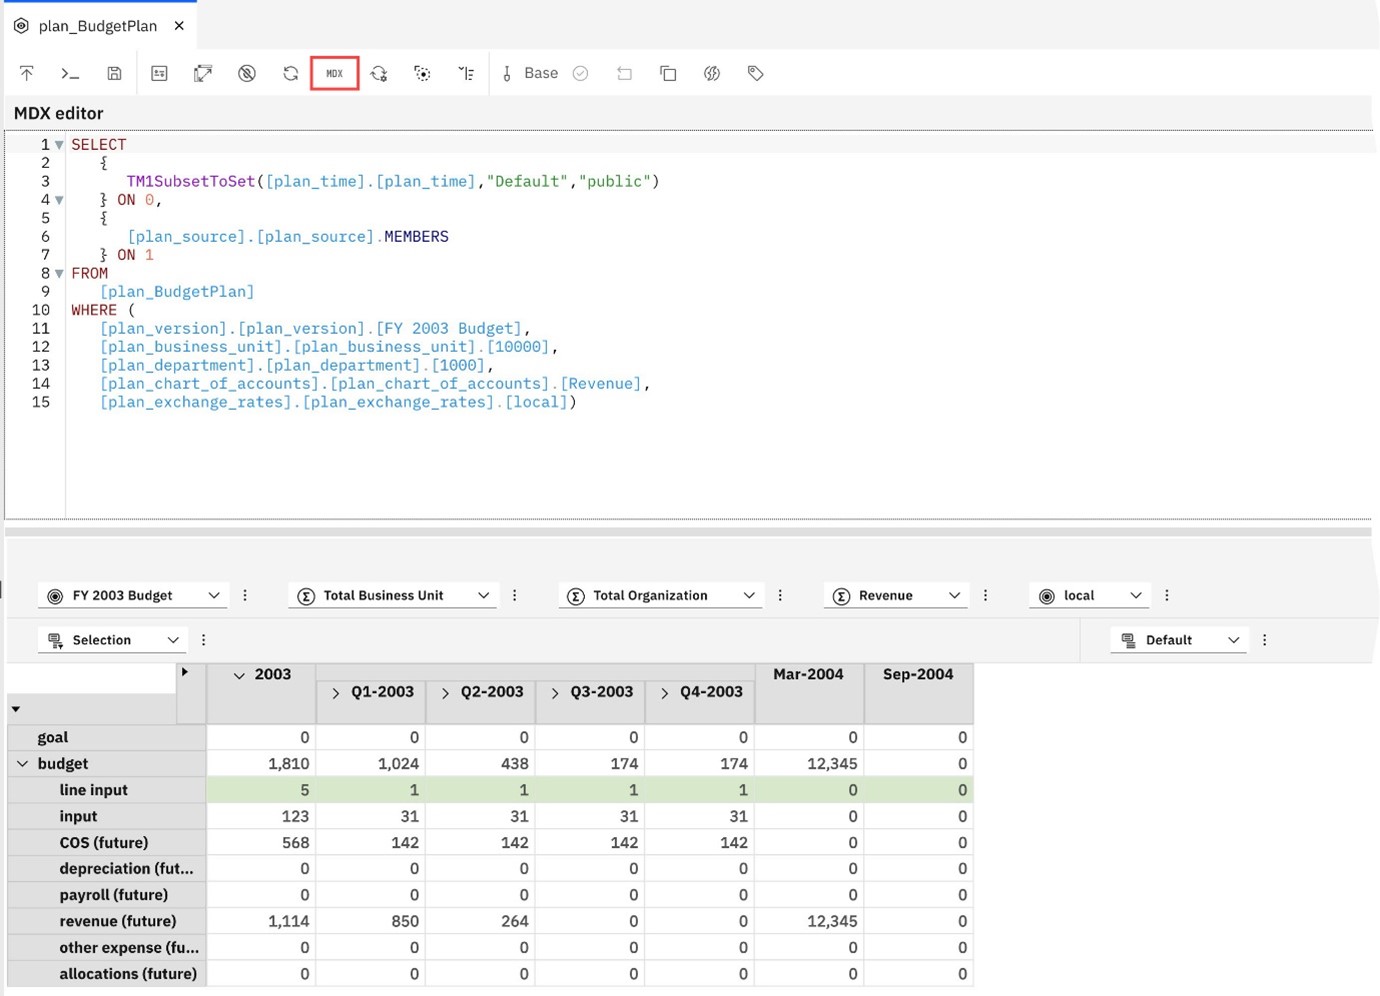
Several updates that have been made to the MDX editor:
- Autocomplete: provides suggestions on dimension names, functions, and other TM1 objects while you are typing.
- Syntax coloring: shows different portions of the MDX statement in different colors for increased readability. For example, keywords are written in red, and tuples are written in blue.
- Undo: allows you to undo the last change.
- Redo: allows you to redo the last change.
- Find and replace: clicking CTRL+f open a dialogs that allows you to search for specific text in the MDX, and replace it.
- Indenting: the MDX editor now automatically formats the MDX script, indenting each line. When you make changes in the view, the MDX editor updates with the correct formatting. You can manually indent the lines in the script by clicking Indent script in the MDX editor toolbar.
- Apply applies your MDX edits to the view. When you click Apply, a text box appears telling you if the changes were made successfully.
- Synchronize replaces the MDX in the editor with the one represented in the view. After you click Synchronize, click OK to synchronize.
Note: When you make edits in a view, the MDX editor automatically synchronizes to match these changes. However, when you make edits in the MDX editor, the view does not automatically synchronize to match these changes. You have to manually select where you want your edits to apply using the Apply and Synchronize buttons on the MDX editor toolbar.
Add notes to a modeling workbench
You can now add notes to a modeling workbench to keep track of your work, document the purpose of an object or workbench, or instruct team members on the use of a workbench.
To create or edit a note, click the Note icon on the side toolbar of the workbench.
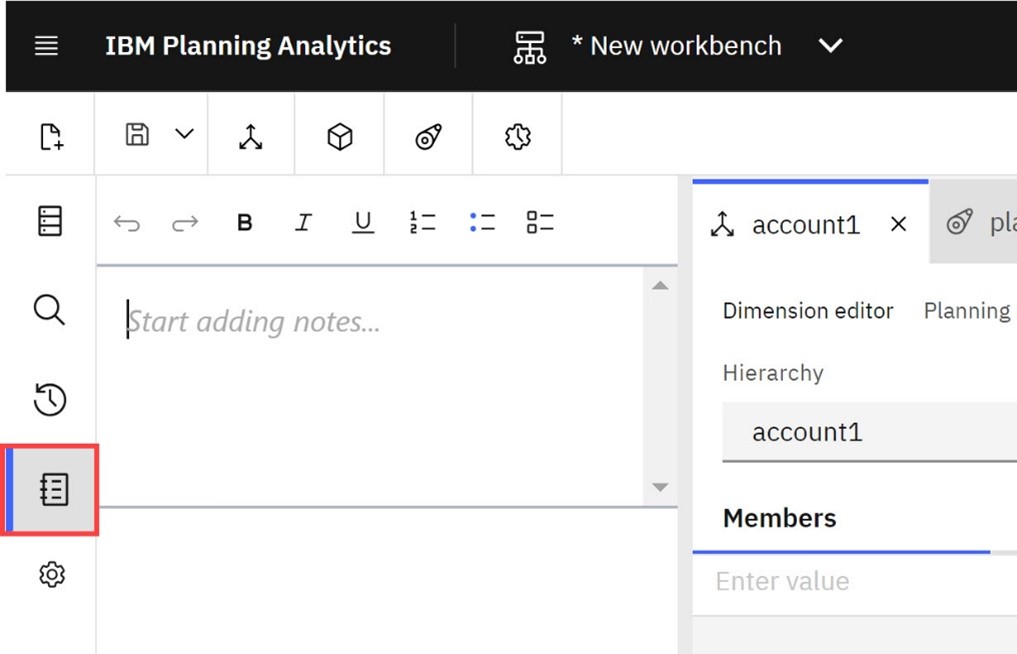
Enter your note text and use the formatting toolbar to apply text formats or create lists. If you enter a valid URL in a note, it displays as a clickable link. Click Save to save the note to the workbench.
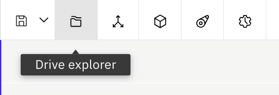
Use the new Drive explorer to access the S: drive (Cloud only)
You can now access the S:/ drive through the Planning Analytics Workspace modeling workbench with the new Drive explorer.
Note: The Drive explorer is not available in Planning Analytics as a Service.
The Drive explorer option is visible to users with Subscription administrator access or those with permission to browse the file system.
Important: Users with access to Drive explorer have full access to the file system in the S:/ drive and the remote server. There is no access control beyond enabling the Drive explorer capability.
Click Drive explorer to open the root of the S:/ drive.
Like in the File manager, you can upload files, create folders, and select files in the Drive explorer. Selected files can be renamed, moved to a new location, copied, deleted, and compressed.
The Drive explorer has an additional capability that lets you connect to the remote server associated with your Cloud. Once connected, you can move files to a new location.
- Click Open remote server from the Drive explorer
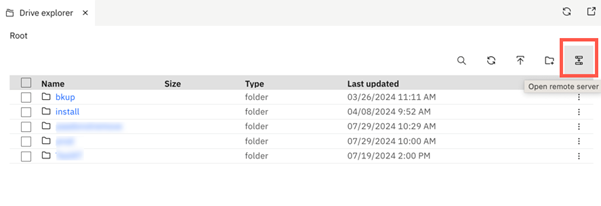
- Log in to your remote server with your Fileshare credentials and click Refresh folder itemsto test the connection. The credentials to connect to the remote server are provided in the welcome kit for that specific Planning Analytics system.
You can now see the files on your remote server.
You can create folders here and organize files and select files to rename, delete, and move them to a new location. When you copy a file from the remote server, you can paste the file to the local S:/ drive only. You can also copy files from the S:/ drive and paste them to the remote server.
WHAT’S NEW IN ADMINISTRATION
The following new and changed administration features are available in Planning Analytics Workspace 2.0.98.
Use the new Satellite Connector to connect to a private network (Cloud only)
IBM Satellite Connector is IBM’s new and improved VPN tunneling technology, which provides a secure connection between Planning Analytics on Cloud and a private network where your on-premise data resides.
Satellite Connector provides functionality similar to Secure Gateway, but Satellite Connector has no bandwidth egress limits, supports more concurrent incoming connections, includes support for the latest generation of VPC networking, and supports a greater number of client connections for client-side high availability.
Deprecation of Secure Gateway was previously announced online and in the Secure Gateway interface on Planning Analytics Workspace. Both Satellite Connector and Secure Gateway are available in Planning Analytics Workspace 2.0.98, but Secure Gateway will be removed from Planning Analytics Workspace in early October 2024. You can review this blog post to prepare for migration to Satellite Connector.
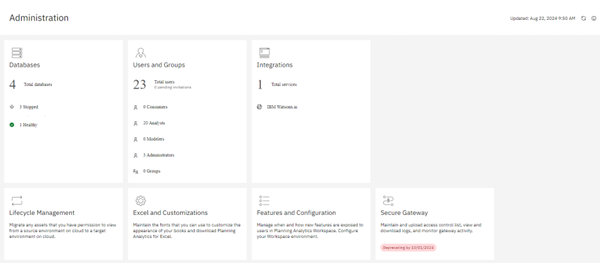
You can create and manage Satellite Connector connections from the Administration page in Planning Analytics Workspace.
Full documentation on using Satellite Connector and migrating from Secure Gateway to Satellite Connector will be available in Planning Analytics Workspace 2.0.98.
Manage user capabilities in Planning Analytics Administration (Cloud only)
Administrators can now manage capabilities for individual users in Planning Analytics Administration on Cloud.
For Planning Analytics Workspace 2.0.98, the most significant capability that can be managed is access to the Drive explorer. This capability must be enabled for a user to access the S:/ drive through the Planning Analytics Workspace modeling workbench.
Initially, only a subscription administrators can manage capabilities and only in a primary environment. However, a subscription administrator can assign the ability to manage capabilities to other administrators in either a primary environment or in a non-primary environment. See the Planning Analytics Workspace 2.0.98 documentation for full details on managing capabilities.
To manage capabilities for a user:
- Open Planning Analytics Administration.
- as a subscription administrator.
- Click the Users and groups
- Click the Users
- Select the user for whom you want to manage capabilities.
- Click the Capabilities tab.
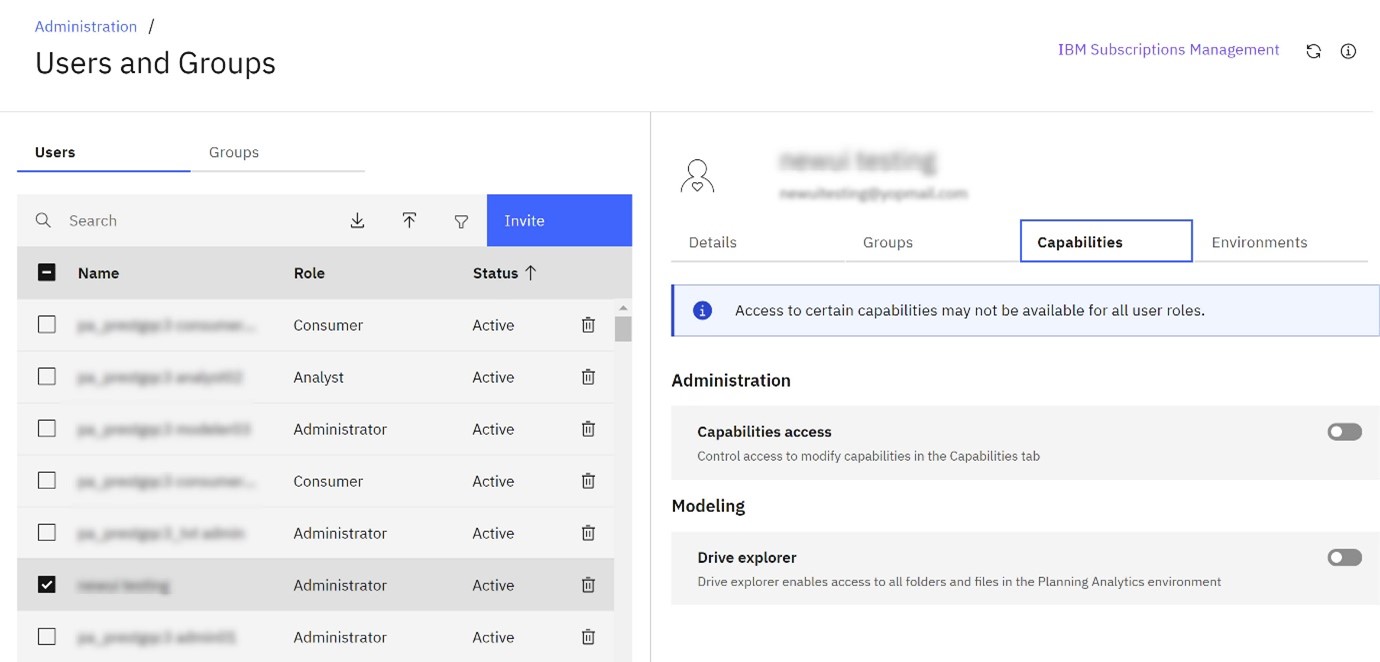
The tab shows the capabilities that can be managed. In Planning Analytics Workspace 2.0.98, there are two capabilities that an administrator can manage.
Capabilities access – Enable to grant an administrator the ability to manage capabilities for users. If this capability is not enabled for an administrator user, the administrator cannot see the Capabilities tab and cannot manage capabilities.
Drive explorer – Enable to give the user access to the Drive explorer on the modeling workbench. The Drive explorer provides access to all folders and files in the Planning Analytics environment.
- Click the toggle to enable or disable a capability for the user.
IBM Cloud Pak for Data integration renamed and multiple deployment capabilities added
The IBM Cloud Pak for Data integration, which supports Decision Optimization in Planning Analytics Workspace on Cloud, was renamed to IBM watsonx.ai in this release. Along with this change, you’ll notice that you can now configure multiple deployments of the IBM watsonx.ai integration.
The Integrations tile now looks slightly different to support the ability to configure multiple deployments of the watsonx.ai integration. To add a new deployment, click Add or use the context menu of an existing deployment to duplicate it and edit the relevant fields.
Use the Status toggle to enable or disable a deployment.
You can modify or delete an existing deployment through its context menu.