SC100 release notes:
The list of new features are provided in the following link:
https://www.ibm.com/support/pages/node/7177176
The defects list is in the link below:
https://www.ibm.com/support/pages/node/6192099
A quick review of the key changes:
Key call outs in this release
- Search process and rule code
You can search process and rule code in the Planning Analytics database directly from the workbench.
The search panel in the workbench includes a new tab named Search code. On this tab, select a database and type your keywords. Use the filter next to the database name to restrict the search to only processes or only rules. The default search includes Cubes, Rules, Views, Dimensions, Hierarchies, Sets, Processes and Chores.
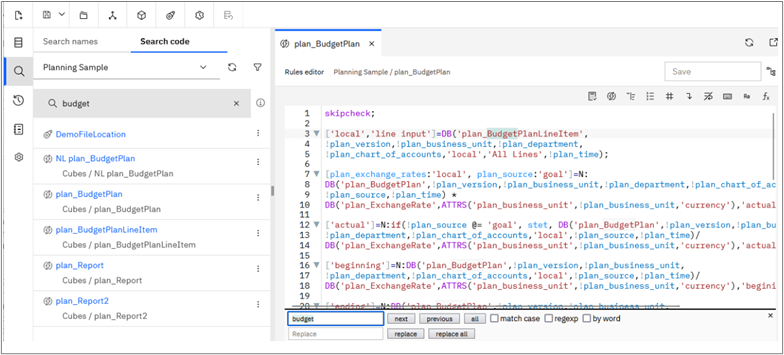
The search results include the processes and rules that contain the specified keywords.
When you click a result, the rule or process editor opens with the first instance of the keyword highlighted in the code.
Use the buttons in the bottom panel of the editor to locate other instances of the keyword in the code.
Changes in modeling
- Manage performance monitoring from the modeling workbench
Performance monitoring can now be started or stopped for a database from the modeling workbench in Planning Analytics Workspace.
When performance monitoring is enabled, performance and usage statistics are written to the }Stats control cubes for the database. These control cubes can be used to review minute-by-minute statistics for chores, clients, cubes, processes, rules, and the database (server).
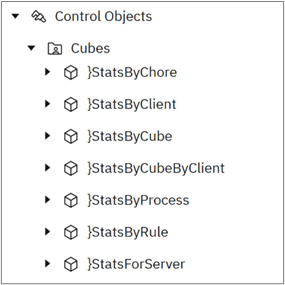
To manage performance monitoring from the modeling workbench:
- On the Databasestree, click the Actionmenu for a database.
- Click Performance monitor.
- Enable or disable the PerformanceMonitorOn
- Click Save.
The setting of the PerformanceMonitorOn option on the modeling workbench determines the status of the PerformanceMonitorOn configuration parameter for the database.
Administrators can continue to manage the PerformanceMonitorOn configuration parameter in Planning Analytics Administration.
The most recent setting for the PerformanceMonitorOn configuration parameter takes precedence, whether set on the modeling workbench or in Planning Analytics Administration.
- Display the element index in the dimension editor
You can now display the element Index value in the dimension editor. Index is a property that determines the order of elements within a dimension. The index value is unique for each element.
The Settings in the dimension editor now include the Element index option, which you can use to show or hide the index values for dimension elements (members). When you enable the Element index option, the the dimension editor includes an Index column.
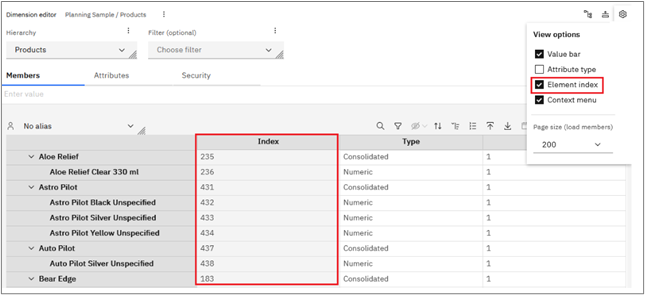
The Element index option is also available in the modeling workbench Profile and settings, under Settings > Dimension editor.
You can sort the dimension elements by index with these new sort options:
By index, ascending – Sort members by index, in ascending order.
By index, descending – Sort members by index, in descending order.
By index, hierarchically ascending – Sort members within a hierarchy by index, in ascending order.
By index, hierarchically descending – Sort members within a hierarchy by index, in descending order.
- Drive explorer enhancements
Three new security and operation management features have been added to the Drive explorer in the Planning Analytics Workspace modelling workbench.
- Support for private keys and passphrases in Secure File Transfer Protocol (SFTP)
You can now use private keys or passphrases in Secure File Transfer Protocol (SFTP). In the Remote environment tab in the drive explorer, click the Private key toggle. You can then enter a Private key or Passphrase.

- Cancel current operation
Using inline notifications, you can now cancel an operation while it is being performed. When an inline notification displays the status of an operation, click Cancel to stop the operation.

- Ignore locked files during copy, move, delete, and compress operations
When you perform copy, move, delete, and compress operations, locked files do not prevent these operations from completing. Instead, after these operations are complete, a message lists the locked files that were not included in the operation.

- Transaction log enhancements
- Number of log entries displayed
You can now increase the number of log entries on the screen by scrolling to the bottom of the list of entries.
The Maximum entries option has been removed, since there is no longer a maximum number of entries that can be displayed.
- Full query results with transaction downloads
You can now download full query results. To download full query results, click the Download icon. Notifications appear when the download starts, and when it finishes.
- Filter based on Prior value and New value
When performing a search, you can now filter by Prior value and New value.
Note: If the Prior value or New value you are inputting is a string value, start your query with ‘ (single quote) .
- Filter based on seconds
When performing a search with a custom time period, you can now filter by seconds.
- Users selection enhanced
When filtering a search by users, you can now find specific users using the new Find users option. To do this, click Users/Chores then click Find users. A list of users from the TM1 model is displayed. You can select one or more users to add to the filter.
- Select multiple log entries
You can now select multiple log entries. To select multiple log entries, click on an entry, press the shift key, and select another entry. All entries in between are included in the selection.
Changes in applications and plans
- My tasks tab available on the homepage
The Planning Analytics Workspace applications and plans homepage now has a tab called My tasks.
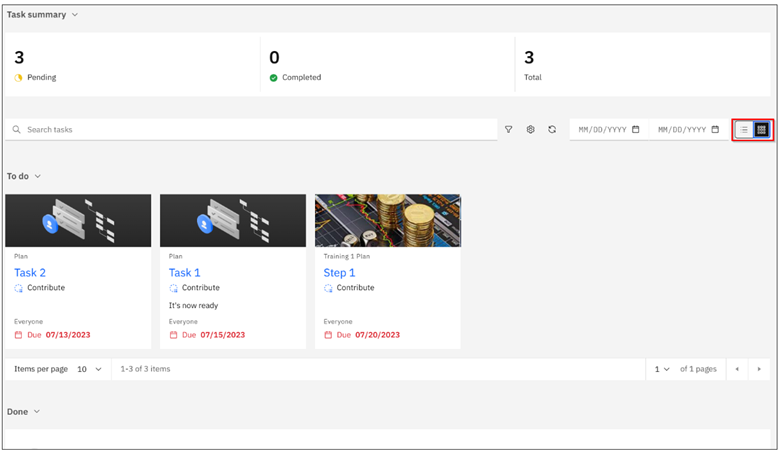
The My tasks tab provides information about your current and completed tasks in relation to Plans.
The My tasks tab is divided into three sections: Task summary, To do, and Done.
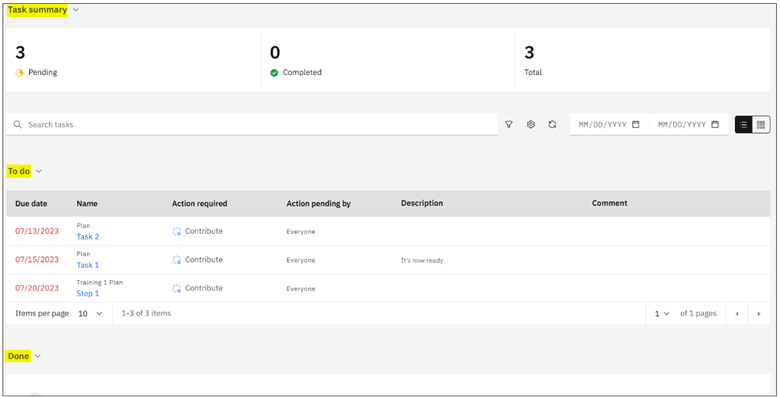
By clicking on the View switcher highlighted below the tab can be switched from Table view to Tile view:
More details on each section
Task summary
The Task summary section provides at-a-glance information about your pending and completed tasks, allows you to search for tasks with certain criteria, and allows you to change the layout of the tab. Features include:
- The search bar allows you to search the content in the To Doand Donesections by task name.
- The filter icon allows you to filter the tasks in the To Doand Done sections by the action required and the status of the task.
- The date range selectors allow you to filter tasks by their due date. You can search for tasks due within a range of time, and the tab only displays tasks in that period.
- The view switcher allows you to change the layout between table view and tile view.
- The settings button has different options depending on the type of view you choose. If you choose the table view, you can adjust the size of the rows, and in tile view you can show or hide descriptions and thumbnails.
- The refresh button refreshes the page.
To do
This section has information on tasks requiring further action. Features include:
- Due date: when the task is due.
- Name: the name of the task. Clicking on the name of a task opens it. From here, you can contribute, approve, or reject the task.
- Action required: the type of action required to advance the task to the next step.
- Action pending by: the users required to complete the action in the Action required section.
- Description: a description of the task or required action.
- Comment: comments added about the task or required action.
Done
The Done section has information on the tasks you completed. Features include:
- Due date: when the task is due.
- Name: the name of the task.
- Status: the current status of the task.
- Approval done by: the user who approved the task. If the task has not been approved, this section will state that the task has not been approved, or if approval is not required.
- Description: a description of the task.
- Comment: comments added about the task.
Changes in books and reporting
- Discover AI-generated insights with Chart insights
A new feature, Chart insights, was made available in Planning Analytics Workspace 2.0.99 soon after its release.
You can use Chart insights to get AI-generated insights in the form of summaries and key points to view an easier interpretation of a chart’s data.
Important: The Chart insights feature is part of the Planning Analytics AI assistant add-on, which requires a separate license purchase.
It is not included in a standard Planning Analytics Workspace license. To purchase a license, contact your IBM sales representative or go directly to your IBM account.
