The list of new features are provided in the following link:
https://www.ibm.com/support/pages/node/7157860
The defects list is in the link below:
https://www.ibm.com/support/pages/node/6192099
A quick review of the key changes:
Key call outs in this release
-
Format spacer cells in the Format manager
At the time of writing this change has not been implemented.
There was a change planned for the Format Manager in this release, but nothing has occurred.
The change listed under Features and Configuration was to replace the “Format Values” button on the Toolbar with the Format Manager. This was due to be released in SC97.
We will keep you posted on this
-
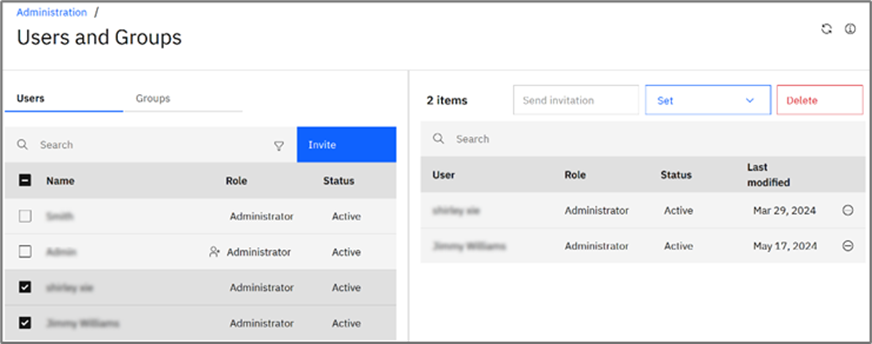
Improved User Interface for Subscription Administrators in deleting users
On the Users and Groups > Users tab, when a Subscription Administrator selects multiple users, the Delete button appears in the right panel.
General Updates
Administrators, Modelers, and Analysts can now use a single Settings editor to define settings and preferences for multiple Planning Analytics Workspace components and features.
The Settings editor is not available for Consumers.
While the Settings editor defines global settings for components and features, you can still modify settings directly in an instance of a component.
For example, when using the dimension editor, you can click the Settings icon and modify the settings for that instance of the editor.
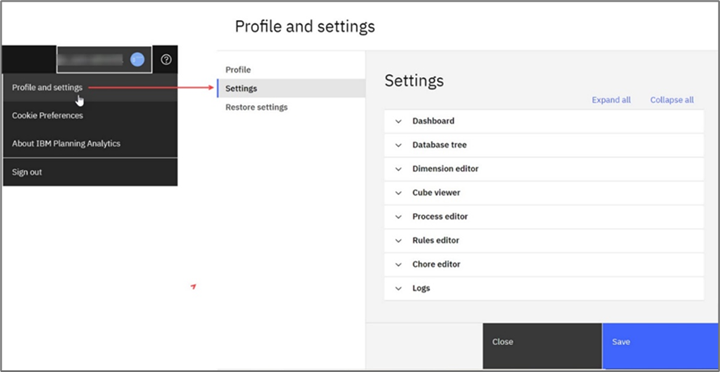
To use the Settings editor:
- Click your user name on the Planning Analytics Workspace title bar.
- Click Profile and Settings.
- Click Settings.
- Click a settings category, then define your settings.
The components and features available in the Settings editor vary according to your user role in Planning Analytics Workspace. You’ll see only the components and features for which you can set preferences.
For example, an Administrator sees all components and features, but an Analyst sees only the Dashboard, Database tree, Dimension editor, and Cube viewer.
You can also reset settings to default values from the same location:
- Click your user name on the Planning Analytics Workspace title bar.
- Click Profile and Settings.
- Click Restore settings.
- Click the category for which you want to restore settings to default.
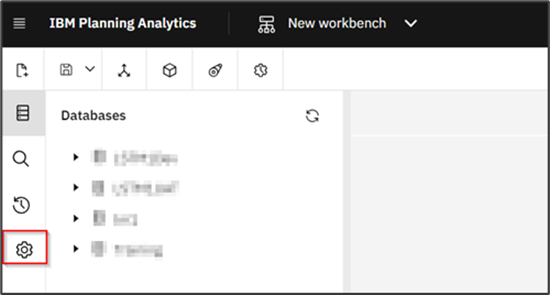
These features are also available for Administrators and Modelers from the Workbench
Changes in Books and Reporting
- Action button references are now updated when you copy and paste books to a new folder
When you copy and paste multiple books from one folder to a different folder, action buttons in the books that reference any other books that are being copied at the same time are automatically updated.
The action buttons are adjusted to point to the new location of a copied/pasted book, not to the original location.
If you copy and paste a book to a new folder, but the book contains an action button that references another book in the original folder, the action button continues to reference the book in the original folder.
- Plot members from the same dimension in certain charts
Certain visualisations can now plot members from the same dimension, which makes it easy to view and compare members quickly.
In the following example, all members of the month dimension are displayed in the Line chart as measures on the y-axis.
Notice in the Fields panel, the Colour field shows an item called y-axis: 3 members, which shows that three members display different colours on the y-axis.
This item in the Colour field acts like any other hierarchy. You can drag it from the Colour field to other fields like the Repeat (column) to see individual charts for each member.
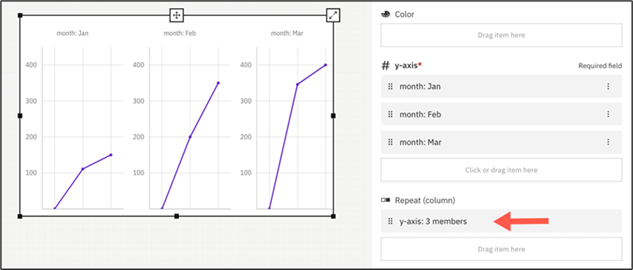
You can click into an empty y-axis field to plot another member. To remove an existing member, click the menu icon for the member you want to remove and select Remove.
When the set changes, the y-axis field also updates to show the members in the new set.
Similarly, when you create a combination visualization, members of the column dimension are plotted on the Column length or Length fields and the Colour field displays the set of members.
In the Line and column chart, members of the column dimension appear on both the Column length and Line position fields.
You can then choose which members should display as columns and which members should be a line.
The following visualizations can plot multiple members from the same dimension:
- Column
- Line
- Line and column
- Bar
- Stacked bar
- Stacked column
- Marimekko
- Point
- Area
- Refresh the current set and MDX query without making changes
You can now refresh the Current set and the MDX query without making any changes to the set or the MDX string.
The Reset button for the Current set in the set editor now also allows you to refresh the set even if there are no changes to the set.
Similarly, you can use the Commit button in the MDX to refresh the query without changing the MDX string.
Previously, both the Reset and Commit buttons were disabled until changes were made.
Changes in Plans and Applications
- Create color-coded tags in application sections
Color-coded, custom tags in plan tasks and application sections help you to quickly identify tasks or sections on the Overview page.
You can create tags on the Details tab when creating or editing a task or section.
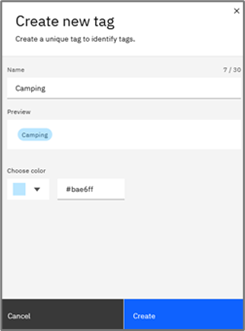
To create and add a new tag to your task or application, follow these steps:
- On the Section detailsor Task details tab, click into the Tags field, then click Create new tag.
- In the Namefield, enter a label for your tag.
- Choose a color for your tag. You can see what the tag will look like in the Preview Then click Create
- Expand the Tags field, select the tag just created, and click Save to add it to the section
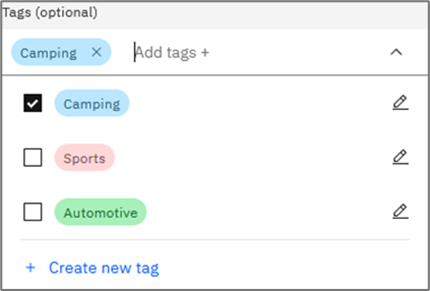
Any tags created are saved to the plan or application. This means all tasks in a plan or sections in an application can share the tags
that are available in the same plan/application but can’t access tags from other plans/applications.
Click the Edit a tag icon next to a tag to edit or delete the tag.
Important: When you delete a tag, the tag is removed from all tasks or sections that use the tag.
Changes in Modelling
Sort hierarchy members in the dimension editor
Multiple sort orders can now be applied to hierarchy members in the dimension editor.
Click the Sort members icon on the toolbar to access the Sort options
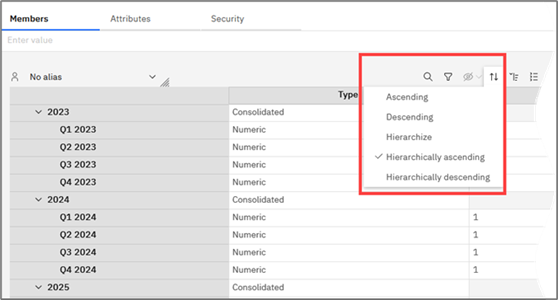
The following sort options are available:
Ascending – Sort members in ascending order.
Descending – Sort members in descending order.
Hierarchize – Organize the members of a specified set into hierarchical order.
Hierarchically ascending – Sort members within a hierarchy in ascending order.
Hierarchically descending – Sort members within a hierarchy in descending order.
Changes in Administration
- Improved user interface for deleting objects
The delete icon in Planning Analytics Workspace Administration is now located next to each item name in all administration interfaces.
For example, the following image shows the delete icon next to each database name.
As always, please take the time to read the link as there are more changes and details in this release not covered above.