Key call outs in this release
- Use the Format Manager to apply formatting to hierarchies
Formatting rules can now be created and applied to hierarchies in a view. This is done in the new Hierarchy tab in the Format Manager
To use it:
-
- open the view to be updated in a book,
- right-click a member in the view and select Format manager > Hierarchy or select the Format Manager > Hierarchy on the tool bar
- Select the dimension and hierarchy to be updated and click Add format.
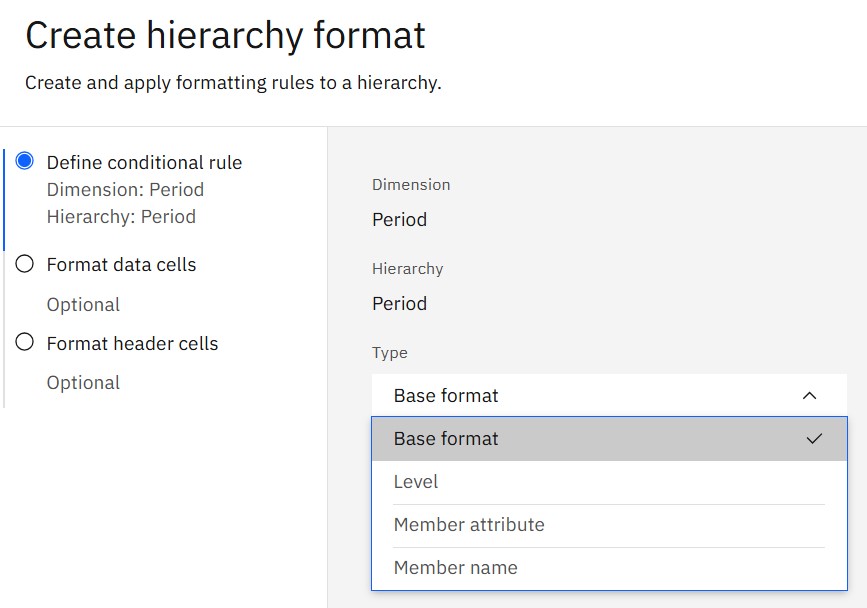
- The following screen will appear:
-
- Define the rule by selecting the condition type:
- Base format – Applies the rule to all of the members in the hierarchy.
- Define the rule by selecting the condition type:
Level – Applies the rule to members of a selected hierarchy level.
Member attribute – Applies the rule to members with a specific attribute value.
Member name – Applies the rule to members that contain a specific value in their name.
The screen shot below shows formatting based on Level
-
- Click Apply to save the format
-
- The order in which the formatting rules apply is as follows:
-
-
- Member formats
-
-
-
- Hierarchy formats on the Columns
-
Hierarchy formats on the Rows
View formats
-
- For multiple hierarchy formatting rules, the first rule has the highest priority. The priority of formatting can be changed by dragging the rules up or down the list.
Changes in modeling
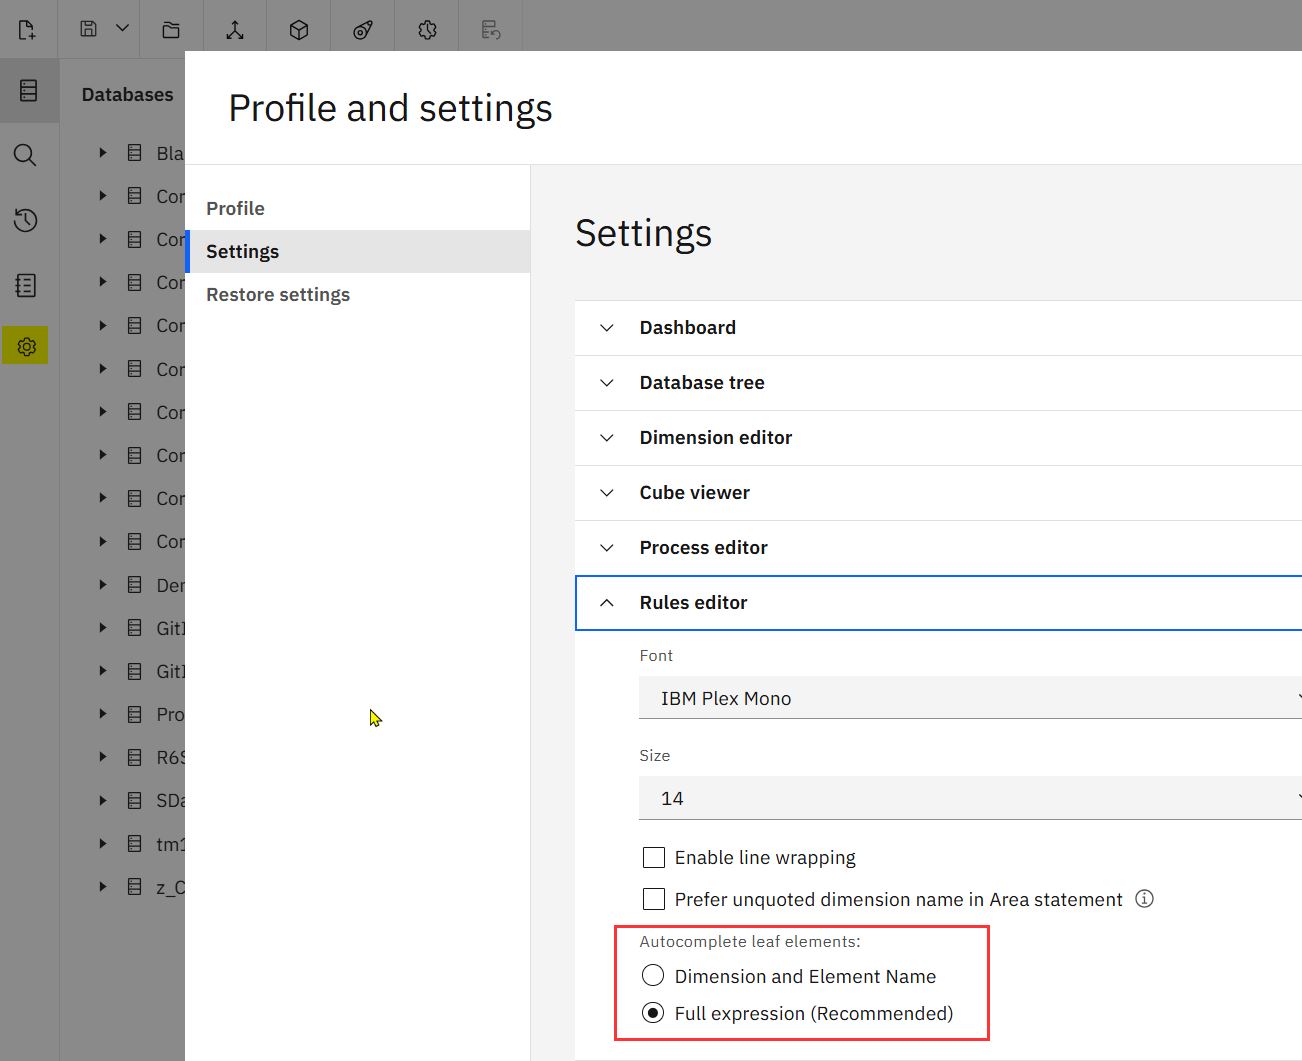
- New auto-complete options in the rules editor in workbench preferences
New options are available in the modeling workbench preferences that specify how leaves display in auto-complete when editing rules.
You can choose to see:
- Dimension name and element, eg: ‘Sales Measure’:’Revenue’ or
- The full expression which includes the heirarchy, eg ‘Sales Measure’:’Sales Measure’:’Revenue’
As shown in the examples above the Element and Dimension names are shown in different colours making it easier to differentiate between them.
To set up the auto-complete preferences in the Rules editor, use the following steps:
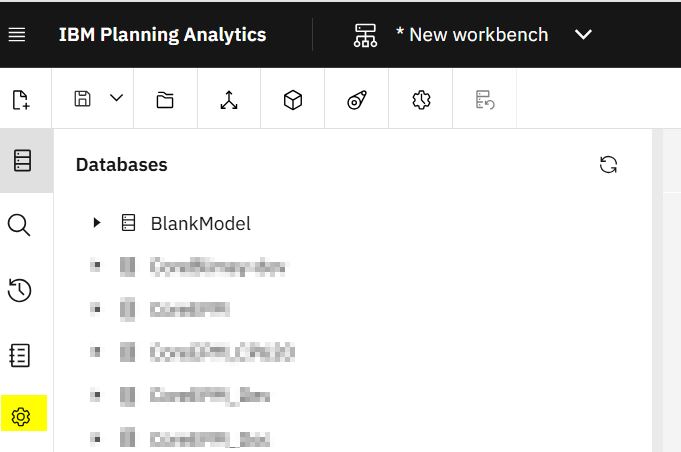
- Click the Preferences icon in the modeling workbench
-
-
- Click the Preferences icon in the modeling workbench
-
- Click on Settings > Rules editor and then select the applicable option in the Autocomplete leaf elements and click Save
- Change the member type to consolidated in the dimension editor
You can now change the properties of a leaf member from a numeric or string type to consolidation without setting children in the modeling workbench
Important: The feature requires TM1® 11.8.29 or a later version, or TM1® 12.4.8 or a later version
To change the member type in the modeling workbench:
- On the Databases tree, right-click the dimension you want to work on and click Edit dimension.
- Click the Members tab on the dimension editor.
- Select the desired member type in the Type column of the leaf member that you want to change.
- Create shortcuts to all TM1 objects in the modeling workbench
The shortcut feature in the Planning Analytics Workspace modelling workbench now supports all object types in the TM1 database, allowing you to easily group, organize, and access modelling objects. Shortcuts to TM1 objects now save in the Applications folder in the data tree. This folder was previously called Websheets and only supported shortcuts or links to websheets and native views.
Note: This feature requires TM1 versions 11.8.29 or later, or TM1 v12.
Shortcuts can be created for the following objects:
-
- Dimensions
- Cubes
- MDX views
- Native views
- Processes
- Chores
- Websheets
- Subsets
Note: In TM1 v11, you cannot create shortcuts for subsets with hierarchy names that are different from the dimensions.
- To create a shortcut to an object from the database tree:
- Right-click the object and select Add shortcut.
- Select a destination folder or create a new folder within the Applications If the object is already open in the workbench, you can create a shortcut from the workbench tab for each supported object type with the Add shortcut icon.
- After a shortcut is created, you can rename it in the database tree. You can also delete a shortcut.
Note: Deleting a shortcut doesn’t delete the TM1 object.
- You can apply security to the shortcuts and set them to be public or private.
- To use an object through the shortcut, simply double-click or drag the object to the workbench.
Accessing TM1 object shortcuts in books
You can access all shortcuts, except those that are for processes and chores, in Planning Analytics Workspace books, from the Applications folder in the database tree.
- Increase the flexibility of baseline forecasts by allowing users to override default context members
An Administrator or modeler can now set an option that enables users to override default context members and specify a custom scope when running a baseline forecast.
A baseline forecast is set up as follows:
- Click the Home button in the top left corner of the IBM Planning Analytics page
- Click New
- Navigate to Forecasting > Baseline Forecast
- Follow the steps to create a Baseline Forecast

The new functionality has been added to the Scope section of the setup. Click the Allow Override button to allow users to override the default context members and specify a custom scope

When a user runs a baseline forecast with the Allow Override option enabled, they can use the Override context members option to pick an existing member or level for the forecast.
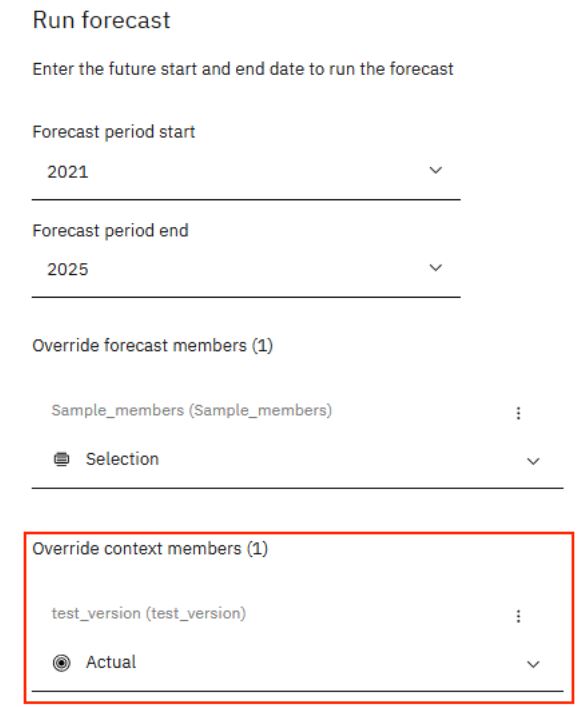
- Though the user specifies a set or level that differs from the default defined in the baseline forecast, the forecast definition remains unchanged – ie the custom selection is only applied at run time.
For more details on Baseline forecast click the following link
https://www.ibm.com/docs/en/planning-analytics/2.1.0?topic=workspace-baseline-forecasts
- Sorting options for items in the File Manager and Drive Explorer
You can now specify your sort order preference for items in the File Manager and Drive Explorer
The steps to set up the sort order are as follows:
-
- Click the Preferences icon in the modeling workbench
- Click Settings > Files and folders
- Update the settings and click Save

Changes in books and reporting
- Set cell background and font colours by using member and hierarchy formats
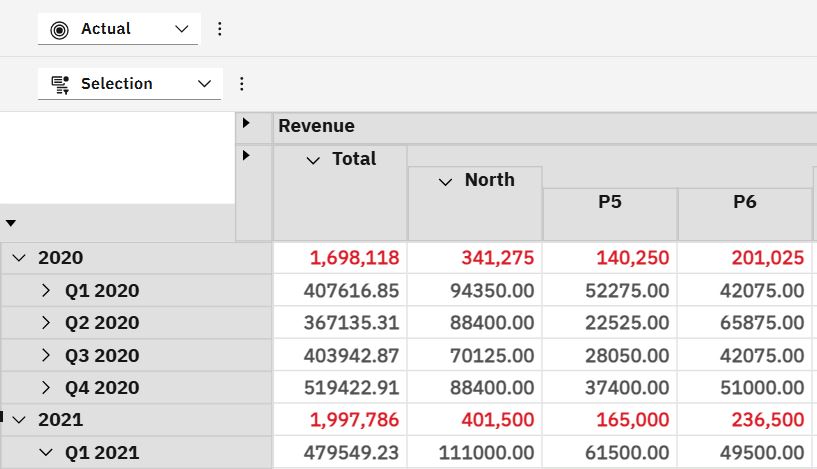
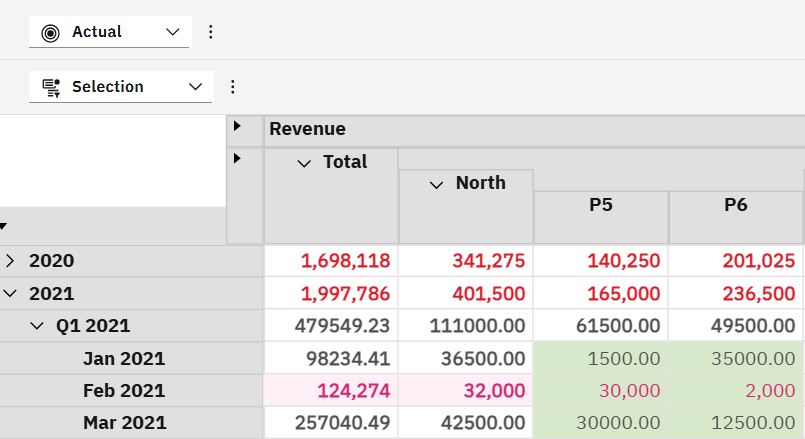
The cell background and font colours for data and header cells can be set with member and hierarchy formats.
The screenshot below shows Feb 2021 having been formatted using the Format manager > member formatting
- Enhancements to the parameter control types for TurboIntegrator processes
The following changes have been made to the Parameter control type when using an action button
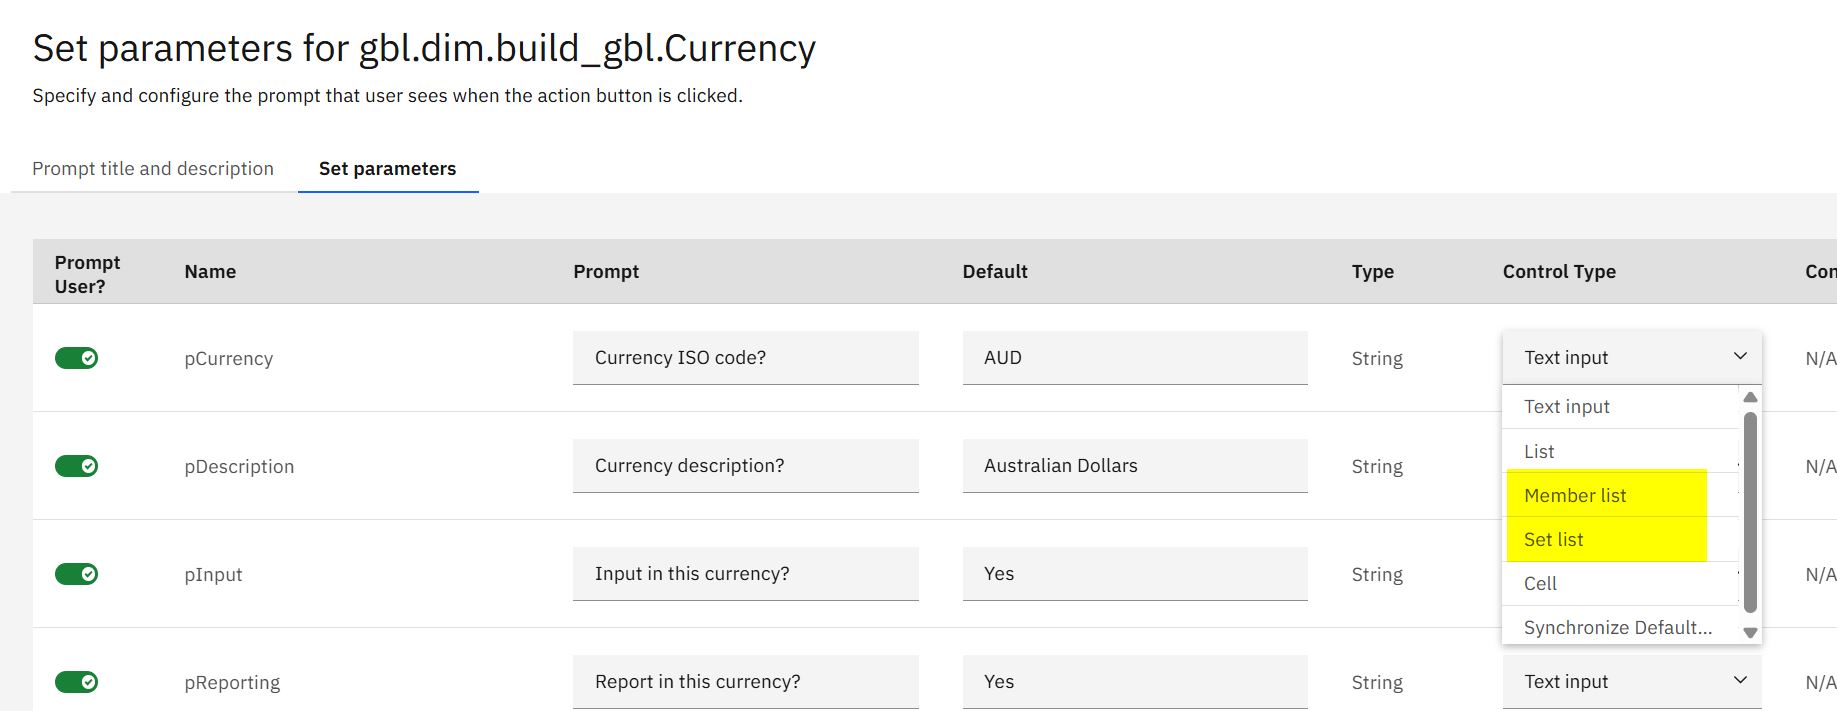
Member List
This was formerly the Dimension list. To use it:
- Select the Member List as the control type
- Click on the pencil in the Control Detail column
- Select the Dimension, Hierarchy and subset (optional) required
- Then click Done
If a subset is not selected then it is the element name that is passed to the TurboIntegrator Process not the alias
Set List
The Set List passes a subset to the TurboIntegrator Process. To use it:
- Select the Set List as the control type
- Click on the pencil in the Control Detail column
- Tick the Show set editor in the parameters prompt

- Then click Done
- When a users clicks the TurboIntegrator action button and selects the applicable prompt a pick list of subsets will appear

There has also been a name change in the modeling workbench Databases in relation to the TurboIntegrator Processes. Error logs have been renamed to Process logs

- Create views by using natural language (Cloud only)
New views can now be created in books with the new Data explorer feature using natural language.
The feature uses generative AI to analyse the query and match it to the relevant data in TM1. An explanation for the logic behind the recommendation accompanies each view.
Important: The Data explorer feature is part of the Planning Analytics AI assistant add-on, which requires a separate license purchase; it is not included in a standard Planning Analytics Workspace license.
To purchase a license, contact your IBM® sales representative or go directly to your IBM account.
To use this functionality:
- Select an exploration in a book.
- In the toolbar, click AI operations and select Exploration analysis report.
- After the report is generated, a notification displays from which you can open the PDF file.
Creating views in the Data explorer is a two-part process:
- Analyze cube– For Data explorer to recommend views, analysed cubes are needed. Cube analysis takes place in the modeling workbench, which allows AI to review the structure of a cube and understand the data.
- Submit query – Once cube analysis is complete, you can go to a book and enter your query in the Data explorerto get recommended views.
The steps to run a cube analysis and create a view in Data explorer are as follows:
- In the modeling workbench data tree, go to the cube that you want to analyze.
- From the cube’s menu, click AI operations > Analyze cube and click Analyze.
Note:
- Access to CubeAttributes, DimensionAttributes, and the corresponding SubsetAttributes control cubes is needed.
- The status of a cube analysis can be checked by clicking AI operations > Analyze log.
- After the cube analysis completes, go to the book where the view is to be created.
- Click AI operations and select Data explorer.
- Select the database and analysed cube with the data tto be used to create a view.
Note: If Auto-select is chosen for the analysed cube, the most relevant cube is automatically selected to create a view, based on the query.
- Enter the query in natural language. For example, “Show me sales performance trends over the last year” or “Show me 2024 sales of mobile devices in Australia”.
- Click Submit.
A view generates along with an explanation for the recommended view and the cube that is chosen to generate the view.
Other points:
- The view can be added to the book in edit mode.
- The rows and columns can be switched, dimensions can be moved around, sets can be edited and levels changed.
Changes in Administration
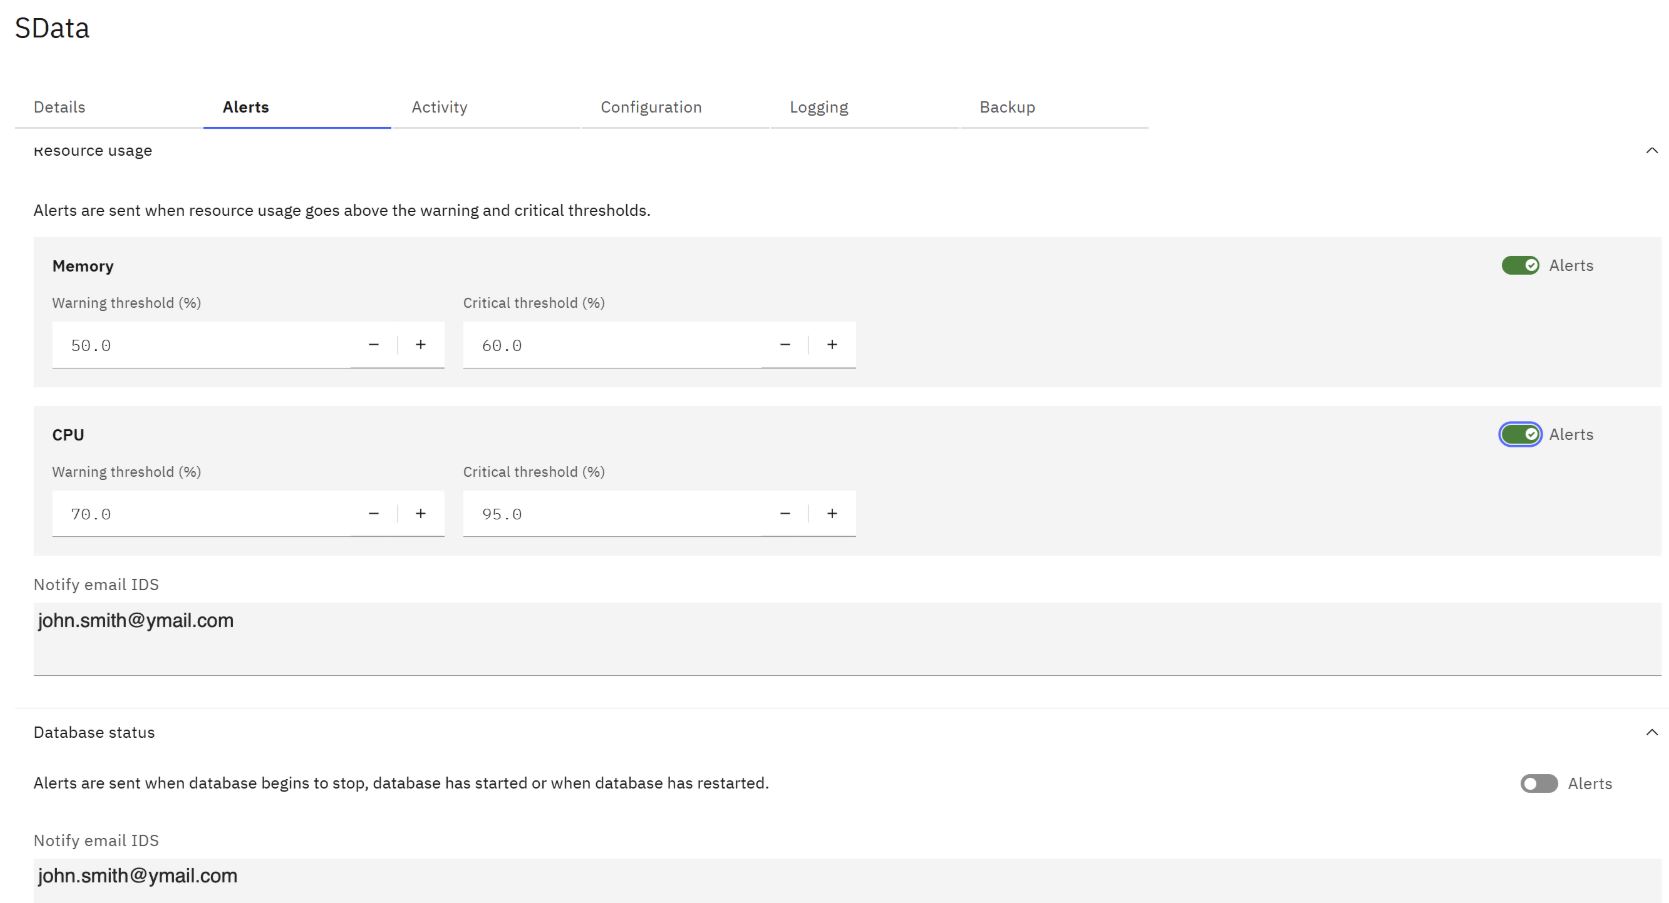
- Set database thresholds and alerts in TM1 Database 12
You can now set database thresholds and alerts in TM1 Database 12 for Memory and CPU usage metrics.
The Warning and Critical thresholds can be set for the following metrics for each database:
- Memory usage – this measures the database memory usage in GBs.
- CPU usage – this measures the database CPU usage as a percentage of the total CPU capacity on the system.
An Email Alert can be triggered when a data metric reaches a critical state or the database starts, stops or restarts