The link to the changes is below
https://www.ibm.com/support/pages/node/7148297
The link to the Defect resolution is below
Key callouts in this upgrade
- Enhancements to the File Manager
The File manager tool on the modeling workbench currently shows the files loaded to the model_upload subfolder in the PA Data folder. The files can be downloaded or deleted from the screen
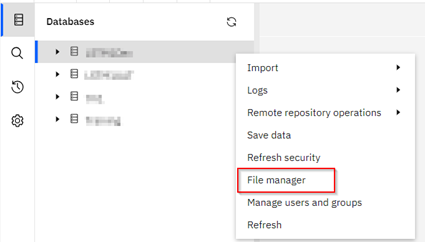
Changes to the File manager tool in this release include the following actions:
-
-
- Create folders and subfolders
-
Folders and subfolders can now be created in the File manager. If a folder is deleted so are any subfolders or files.
-
-
- Cut, copy, and paste files
-
Files can be moved or copied to other folders within the File manager. The Cut and Copy options display in the toolbar when one or more items are selected.
To cut or copy, select one or more items and click Cut or Copy. The selected files will be displayed in alphabetical order as a horizontal list.
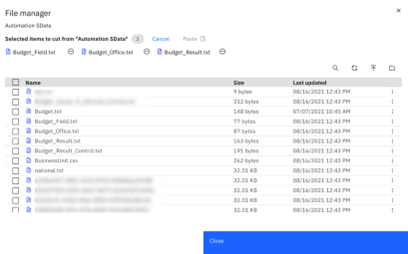
Once the list of items selected have been reviewed, they can be pasted to a different folder. To paste a cut or copied item, go to the destination folder and click Paste.
-
-
- Compress and expand files
-
Select one or more files or folders and click Compress to zip them up. Now, to move the zip file to a new location, go to the new location and click Compress again.
To expand a compressed file, select the file and click Expand
Important Note: If IBM Planning Analytics Workspace Local is being used, update the Planning Analytics Administration agent to the version that is included in Planning Analytics Workspace 2.0.95. You won’t be able to use the File manager in Planning Analytics Workspace 2.0.95 unless you update the Planning Analytics Administration agent to the version from the same release. For more information, see Planning Analytics Administration agent (local only).
It will be interesting to see the impact of this change on the Data folder on the Rich client
- New Format Manager
Although this feature is not listed in the changes above, it was noted in release SC94. The functionality will become active with this release
Recap of the changes from Ewa’s SC94 Email
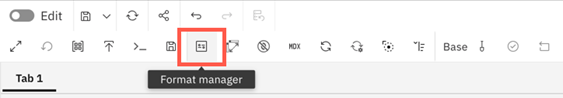
All formatting options for the cube view have been consolidated into the new Format manager.
Instead of using different icons to set up the format values, alignment (members and values), and visualisation properties, you can do this by accessing one Format manager icon from the cube view toolbar. The new icon jumps right into the member formatting option, and the rest of the (replaced) icons are unavailable.
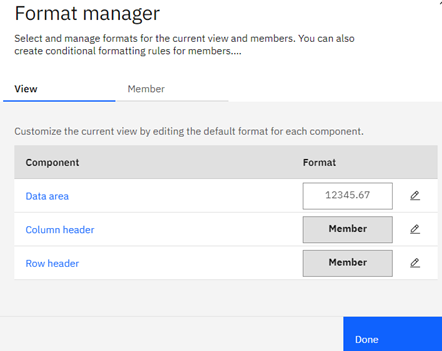
Functionalities under Format manager icon:
- View – change colourfor data cells, row and column headers; change data formats and font formats for data cells, row and column headers
- Members – change data formatsfor data cells; change the font for data cells and headers; change member cell alignment; and change conditional rules for members.
I have checked out the change and a major disadvantage I can see is when you click on the Format manager button, it fills your whole screen, so you don’t get the see the immediate impact of the formatting changes on the cube view you are working on. It does provide an example of what it might look like but I prefer to see the impact on the actual view
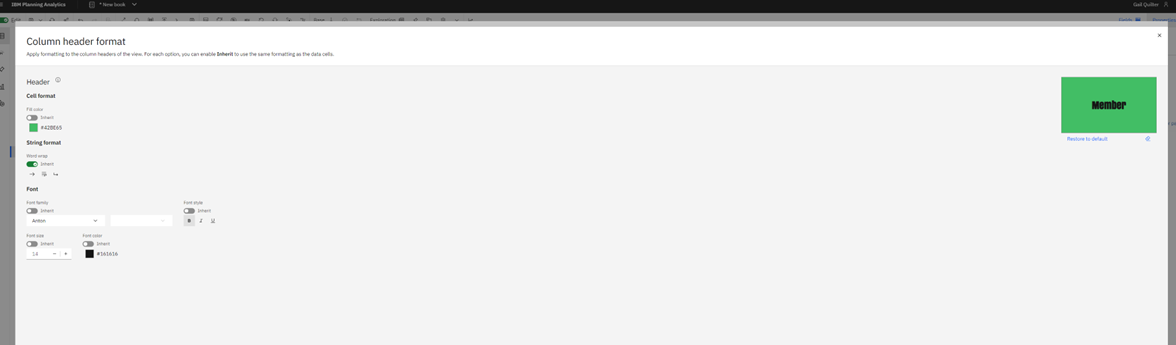
When applying the change you have to click twice to get back to the actual cube view
Changes in Books and Reporting
- New synchronisation settings allow the customised display of hierarchies
New synchronisation settings under Advanced synchronization now let you customise how each hierarchy in the cube viewer or visualization displays when a synchronisation event is received by that widget. The Advanced synchronization functionality is only shown in the Properties > Synchronize > Hierarchies section when synchronisation is enabled for the relevant widget.
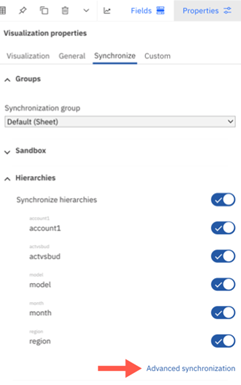
The Advanced synchronization panel is divided into Row, Column, and Filters sections. You can choose what each hierarchy on the Row and Column areas displays when the widget receives a set change or member change synchronization event. You can select the hierarchy display for the Context area under Filters.
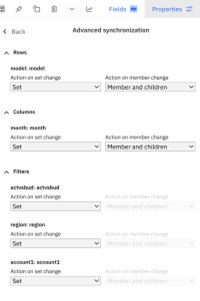
Please refer to the change document above for more details including a short video on this topic
Changes in Plans and Applications
- Create color-coded tags in plan tasks
You can create colour-coded, custom tags in Plan tasks to quickly identify the tasks on the Plan Overview page. Creation of tags is done when creating or editing a task
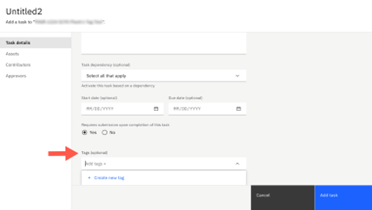
To create and add a new tag to your task, follow these steps:
- On the Task details tab in a planning task, click into the Tagsfield then click Create new tag
- In the Namefield, enter a label for the tag
- Choose a colour for the tag. The Previewfield will display the coloured tag
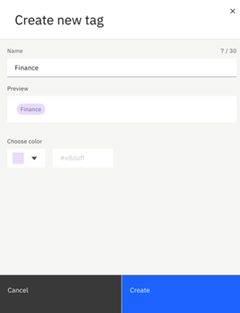
- Click
- Expand the Tags field, and select the new tag
Any tags created are saved to the plan. This means all tasks in a Plan can share the available tags in that same Plan. Tasks can’t access tags from other Plans.
Click the Edit a tag icon next to a tag to edit or delete the tag. When a tag is deleted, it is removed from all tasks in the relevant Plan.
Changes in Modeling
- Revert/reinstate transactions in the Transaction log
Transactions can now be reverted/reinstated from the database transaction log in Planning Analytics Workspace. Previously it could only be done through Perspectives or Architect on the rich client.
To do this:
Open the transaction log from the Databases tree on a modeling workbench by clicking Logs>Transaction log
To open the transaction log for an individual cube, right-click the cube, then click Logs > Transaction log.
Set filtering options as desired. The column headings can be used to sort the transactions.
Select the transactions reverted/reinstated.
Click Revert and then OK to confirm the action.
- Manage database thread activity on the Modeling workbench
Viewing and managing thread activity for a database can be done directly on the modeling workbench rather than having to go to the Administration pane
This new feature provides many of the same capabilities available for thread monitoring in Planning Analytics Administration.
To monitor thread activity on a Planning Analytics database, right-click the database on the Databases tree, then click Threads.
To monitor thread activity on Planning Analytics Engine, right-click the database on the Databases tree, then click Activity.
Definitions on the Thread columns are available in the Change document above
To cancel an individual thread, click the Cancel thread icon adjacent to the final column on the report, then confirm the action.
To cancel multiple threads:
Click Pause. When monitoring is paused, check boxes are available to select individual threads.
Select the threads you want to cancel.
Click Cancel threads on the toolbar, then confirm the action.
Click Resume to resume thread monitoring.
As always, please take the time to read the link as more changes in this release are not covered above.