Key callouts in this upgrade
- New toolbar properties for the cube viewer and visualisations
The nine highlighted icons can now be disabled on the toolbar to provide a more focussed user experience.

See the Changes in Books and Reporting section below for more details
- The extended capabilities in the Git Repository integration
The Changes in Modeling section below covers these changes
Changes in Books and Reporting
- Synchronise gestures across widgets
You can synchronise select gestures (Expand/Collapse, Keep, Hide/Unhide all) across widgets, such as explorations and visualisations.
You can use this feature to build a group with widgets that receive different gestures from other widgets.
You can synchronise the following gestures under Properties > Synchronise> Gestures.
- Expand/Collapse
- Keep
- Hide (and Unhide all)
More details on each of the gestures above are available in the document provided in this Email.
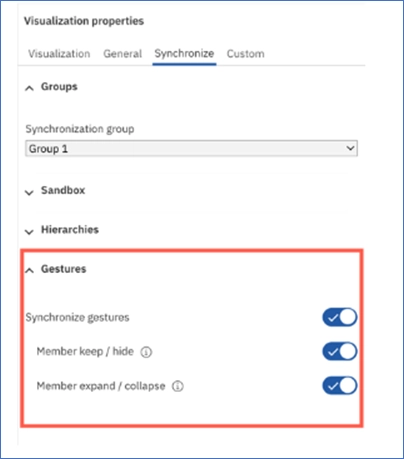
Setting synchronisation for gestures
- Select the widgets that you want to synchronise and click Properties.
- Select Synchronise and under Hierarchies, enable Synchronise hierarchies to enable synchronisation.
- Expand the Gestures section and enable Synchronise gestures.
- To keep or hide a row or column (including unhiding all), enable member keep / hide.
- To expand or collapse a member, enable member expand / collapse.
- Improvements to the alignment of single-cell widgets
Previously, when creating a single-cell widget from the cube viewer, the value in the widget was centred, and the type-in direction was right aligned. Now, when creating a new single-cell widget from the cube viewer, the cell alignment of the widget will match the source cell in the cube viewer. The direction in which text is added when you type in the widget (type-in direction) now also matches the cell alignment of the cube viewer.
For example, if the source cell in a cube viewer is left aligned, any new single-cell widget created from that source cell is left aligned. The type-in direction of the single-cell widget is also left-aligned.
Important: The cell alignment update applies to only new single-cell widgets. Cell alignment in existing single-cell widgets does not change to match the source cell. However, the type-in direction of existing cell widgets was updated to match the source cell’s alignment.
Even if a source cell in the cube viewer uses the default alignment and doesn’t specify a cell alignment, the alignment and type-in direction of a new single-cell widget will match the source cell.
The default cell alignment is left-aligned for string cells and right-aligned for numbers.
After a single-cell widget is added to a book, any changes made to the cell alignment of the source cell do not apply to the alignment or type-in direction of the single-cell widget.
- Set editor access in Properties
You can now restrict and allow access to the set editor for visualisations and explorations in Properties.
Previously, users edited the current set by accessing the set editor from the visualisation or exploration. Now, you can modify access to the set editor that hides options to interact with the set editor.
You can apply this setting using the Allow access to Set editor toggle. You can find this setting in the Properties panel, then open the Set editor section in the Custom tab.
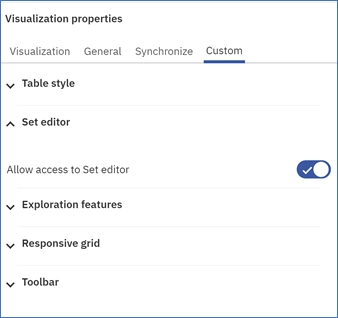
When you turn off the Allow access to Set editor toggle, all set editor menu options are hidden in all visualisations and explorations. In a cube viewer, the menu options Open set editor, Enter named set, and Customise sets are hidden if you click the Action icon for a dimension or member.
For a visualisation, such as Area, you can right-click on the x-axis and y-axis labels to see that the menu options Edit this set and Customise sets are hidden. Alternatively, in the Fields panel, you can click the Action icon in the x-axis and y-axis fields to see that the same menu options are hidden. Also, under the Filters section, you can see that the Edit this set menu option is hidden for each filter where the toggle is off.
The setting of the Allow access to Set editor toggle stays the same even if you change the visualisation to a different one.
If you make multiple selections of visualisations, then the common properties, the Set editor and Toolbar properties, are available. When you change the set editor access, the setting is applied to all the selected visualisations. The Toolbar properties apply to all selections of visualisations as well. For more information on Toolbar properties, refer to the link above.
- New toolbar properties for the cube viewer and visualisations
You can now turn toolbar icons on and off for the cube viewer and visualisations in the Properties panel. Managing which icons are available on the Toolbar allows you to control which features are available for users
Toolbar icons are managed by applying the Toolbar icon settings in the Properties panel. The settings are on the Custom Properties tab, under the Toolbar section.
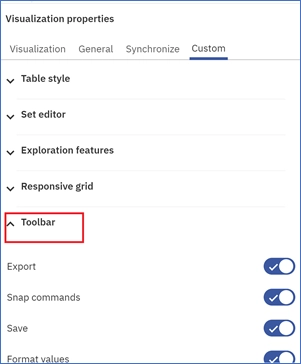
For a cube viewer, you can enable or disable these nine icons:

- Export
- Snap commands
- Save
- Format values
- Edit MDX
- Sandbox selection
- Change visualisation
- Show/hide overview
- Forecast
For Visualisations, the selection is limited to the Save, Format values, Sandbox selection, and Change visualisation toolbar icons. Only the Change visualisation toolbar feature is available to toggle for all other visualisations, such as selector widgets.
If you select both a cube viewer and a visualisation in a book, only the icons common to both are available in the Toolbar properties.
The settings applied in the Toolbar properties are retained even if you switch a cube viewer to a visualisation or a visualisation to a cube viewer. Similarly, the settings are retained when you switch from one type of visualisation to another.
Changes in Plans and Applications
-
General design improvements in Applications and Plans
The Applications and Plans user interface features several design updates in this release.
-
- Applications and Plans header and menu option updates
The header and menu options were moved up in both Applications and Plans to improve space utilisation.
The Add Task option in Plans and Add a Section option in Applications now align with the other menu options.
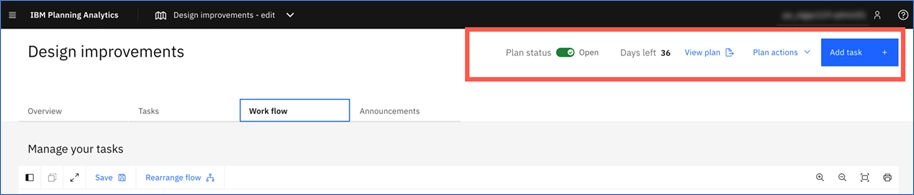
An image in an application or plan header now aligns with the application or plan name. If a plan has a specified timeline, the number of days left to complete all tasks is now in the plan header.
-
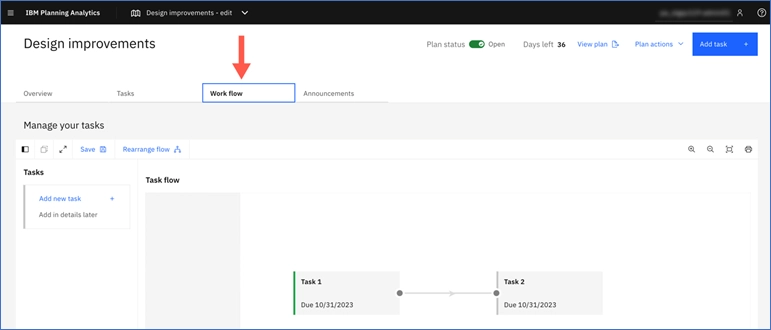
- Work flow tab in Plans
In Plans, the tasks are now shown in the Tasks tab and the task flow in the Work flow tab. You can still create tasks and view and define task dependencies in the Work flow tab.
-
- Usability improvements to the contribution panel in Plans
Usability improvements made to the contribution panel in Plans now make it easy to view plan information and all the tasks in a plan. These improvements aim to better organise tasks for submissions and approvals, which are especially helpful when many tasks are in a plan.
You can now access all the tasks from the Task list in the Tasks section. When you make a selection in the Task list, the Tasks section updates with the selected task’s details such as:
- The due date
- A link to the action log
- A list of assets available in the task
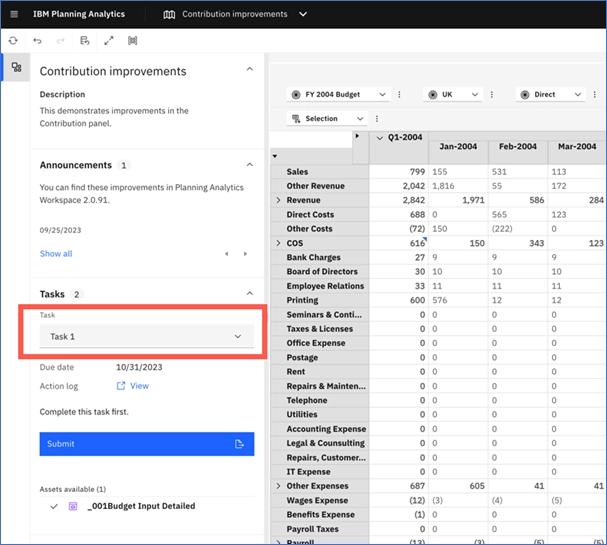
To submit a task, select a task from the Task list and click Submit. When you submit a task, it no longer displays in the Task list.
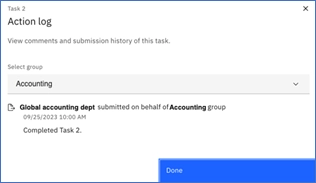
Click View next to Action log to see comments and submissions for a selected task.
If you are a Contributor and an Approver for tasks, they continue to display under separate tabs in the panel. These tabs have been renamed to Approve tasks and Contribute to tasks.
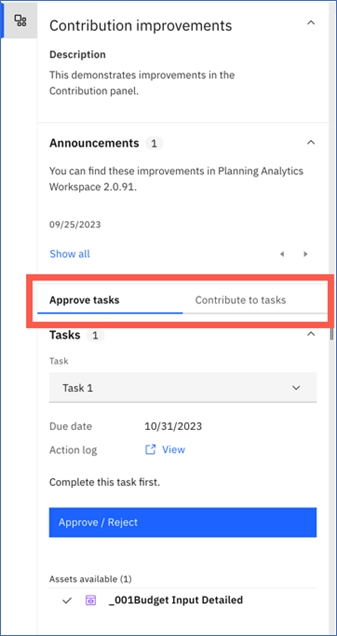
As an Approver, select the task you want to approve from the Task list and click Approve/Reject. After you approve a submission, that task no longer displays in the contribution panel.
Changes in Modelling
- Extended capabilities in Git repository integration
-
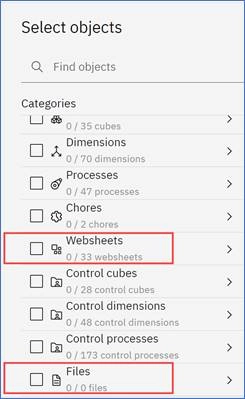
- Support for websheets and files
Websheets and any files of any type can be added to the Git repository.
-
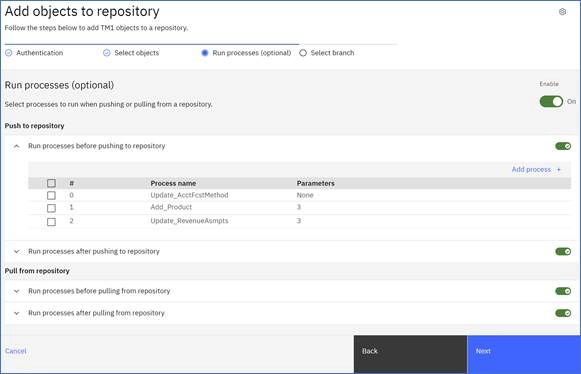
- Run TurboIntgrator processes in association with a Git push or pull
One or more TurboIntegrator processes can be run when adding objects to a repository. A process can be run at any or all of the following points:
- Before pushing to a repository
- After pushing to a repository
- Before pulling from a repository
- After pulling from a repository
-
- Save a configuration for adding content to a repository.
After defining the objects, processes, and branches to add content to a Git repository, the selections can be saved as a file that can be used to set the configuration for later repository updates.
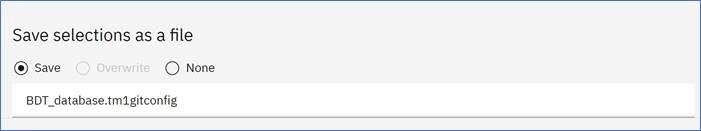
The file is saved to the Planning Analytics Workspace File manager with a .tm1gitconfig extension. Upon subsequent repository updates, you can click Load selections from file to apply the selections saved in the .tm1gitconfig configuration file.
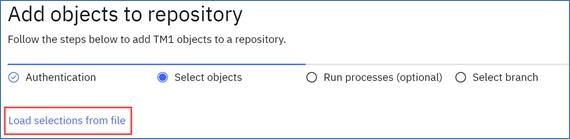
You can modify the repository update configuration after the selections are loaded from the .tm1gitconfig configuration file.
-
- Exclude views when adding cubes to a repository.
All associated views are included when adding a cube to a repository by default. To exclude views, click the Settings icon and enable the new Exclude Cube Views option on the Settings menu.
Changes in Administration
- Create and edit multiple Planning Analytics Local environments (Local only)
You can now manage multiple environments in Planning Analytics Administration Local.
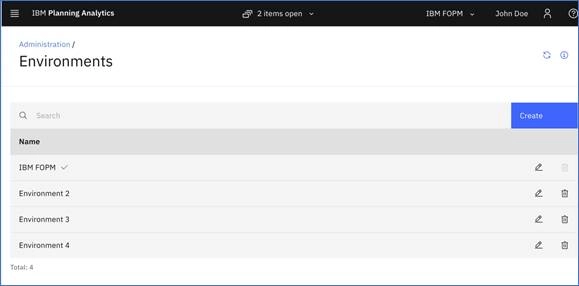
To create a new environment:
- Click the Administration tile on the Planning Analytics Workspace home page.
- Click the Environments
- Click Create.
- Enter an Environment name, Spreadsheet service URL, and Admin host, then click Create.
To edit or delete an existing environment, click the environment name on the Environments page, then click the appropriate icon.
- Add an individual user in Planning Analytics Administration Local (Local only)
A new UI option lets you add an individual user in Planning Analytics Administration Local.
You can continue to upload a .csv file to add multiple users to Planning Analytics Workspace Local.
- Click the Administration tile on the Planning Analytics Workspace home page.
- Click the Users and Groups
- Click the Users
- Click Add.
- Enter the required information for the new user, then click Add.
- Changes to database backup management (Planning Analytics as a Service only)
Planning Analytics Administration 2.0.91 introduces several database administration improvements specific to Planning Analytics as a Service.
To work with backups for an individual database, click the database name on the Databases page, then click the Backup tab.
- You can now view and manage both File(user-uploaded) and Automated backups for a database on Planning Analytics as a Service.
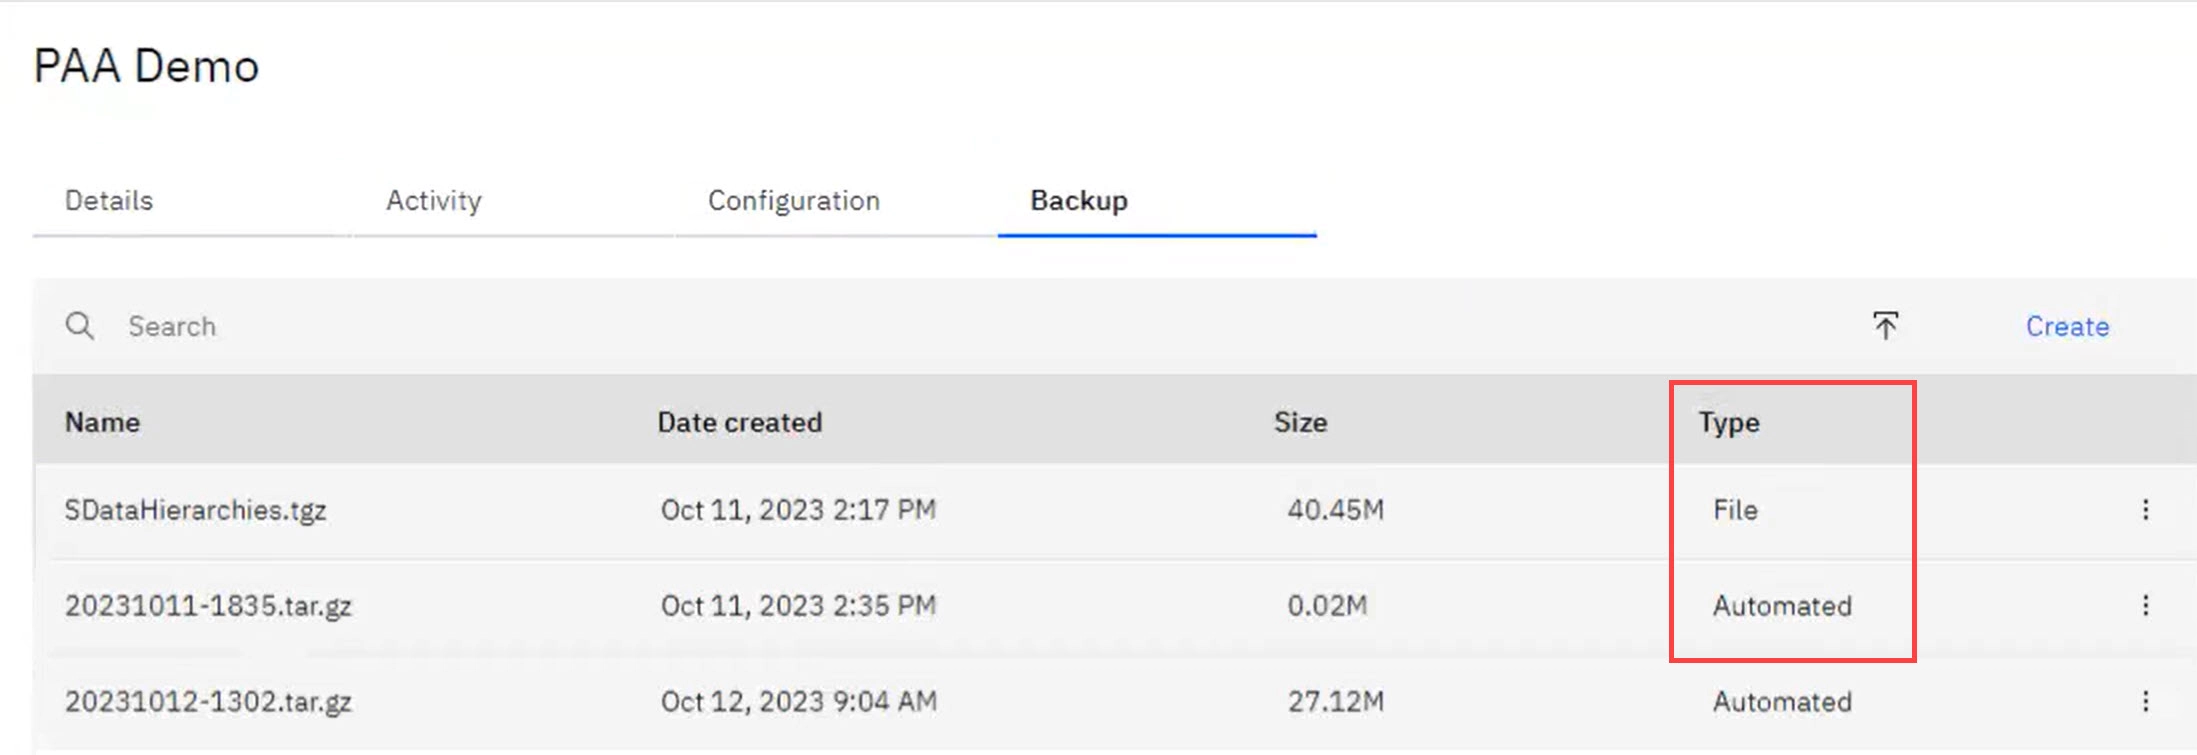
-
- When a database is stopped, you can now view the automated backups available for the database. User-generated backups are not visible when a database is stopped. When a database is stopped, an automated backup can be downloaded, but you cannot upload, create, or restore a backup.
- The Action menu can be used for a file backup to download, restore, or delete a backup.
- The Action menu can also be used for an automated backup to download or restore a backup.
- Click the new Upload icon to upload a file backup for a database.
The link to the changes is below
What’s coming next in IBM Planning Analytics 2.0.91 SC
The link to the Defect resolution is below